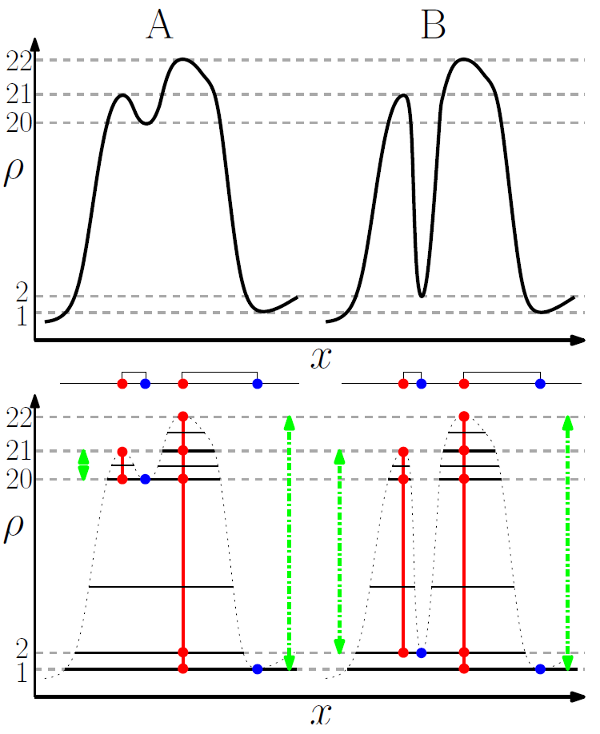
Persistence itself is a relatively simple but powerful concept. To study the topology of a function, one can measure how the topology of its excursion sets (i.e. the set of points with value higher than a given threshold) evolves when the threshold is continuously and monotonically changing. Whenever the threshold crosses the value of a critical point, the topology of the excursion change. Supposing that the threshold is sweeping the values of a 1D function from high to low, whenever it crosses the value of a maximum, a new component appears in the excursion, while two components merge (i.e. one is destroyed) whenever the threshold crosses the value of a minimum. This concept can be extended to higher dimensions (i.e. creation/destruction of hole, spherical shells, ....) and in general, whenever a topological component is created at a critical point, the critical point is labeled positive, while it is labeled negative if it destroys a topological component. Using this definition, topological components of a function can be represented by pairs of positive and negative critical points called persistence pairs. The absolute difference of the value of the critical points in a pair is called its persistence : it represents the lifetime of the corresponding topological component within the excursion set.

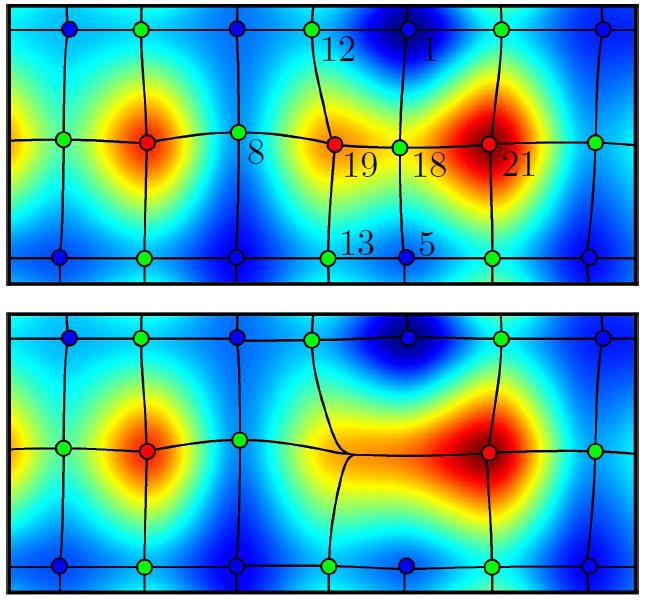
The concept of persistence is powerful because it yields a simple way to measure how robust topological components are to local modifications of a function values. Indeed, noise can only affect a function's topology by creating or destroying topological components of persistence lower that its local amplitude. Therefore, it suffice to know the amplitude of noise to decide which components certainly belong to an underlying function and which may have been affected (i.e. created or destroyed) by noise. In DisPerSE, a persistence threshold can be specified (see options -nsig and -cut of mse) to remove topological components with persistence lower than the threshold and therefore filter noise from the Morse-Smale complex (see figure 2 below).

A very useful way to set the persistence threshold is to plot a persistence diagram, in which all the persistence pairs are represented by points with coordinates the value at the critical points in the pair (see option -interactive of mse or see pdview and read the tutorial section to learn how to compute and use persistence diagrams).